How many stocks make a diversified portfolio?
A stock count alone does not tell you how diversified a portfolio is. Weights, shared exposures and behaviour during bad periods matter too.
Imagine an investment whose value barely moves from one month to the next. The chart is smooth, the reports are calm, and the experience feels reassuring. Most people would call it a safe investment.
That conclusion can be an expensive mistake. A smooth chart tells you only how measured prices moved. It does not tell you whether you can lose money permanently, whether you will be able to withdraw it when you need it, or what it will buy in ten years. Volatility is useful, but it measures only one dimension of risk.
Volatility shows how far an investment's returns tend to move from their average. In 1952, Harry Markowitz showed how variance can measure the spread of returns and covariance their tendency to move together. Many portfolio models therefore use volatility as a proxy for risk.
It is a useful measure. When investments trade frequently, prices are observable and we compare the same periods, volatility describes the scale of ordinary movements and how investments interact inside a portfolio. Building a careful portfolio would be much harder without it.
The problem begins when volatility becomes the whole story. Anything that a measured price misses, or reveals too late, remains outside the picture.
In his memo Risk Revisited Again, American investor Howard Marks of Oaktree Capital defines risk mainly as the possibility of permanent capital loss. There are two routes to it. First, an investor sells during a fall, often under financial or emotional pressure, and turns a decline that might have recovered into a final loss. Second, the investment never recovers because its fundamentals have deteriorated.
The uncomfortable part is that we often cannot tell which is happening while prices are falling. Recovery is not guaranteed. It is wrong to say that every loss is temporary until we sell. Sometimes it is. Sometimes it is not.
This is also why volatility still matters. Marks acknowledges that price swings can cause harm when they force a sale, trigger a poor emotional decision or coincide with a need for cash. Volatility does not create the loss by itself. It matters when it pushes you into a decision you would not otherwise make.
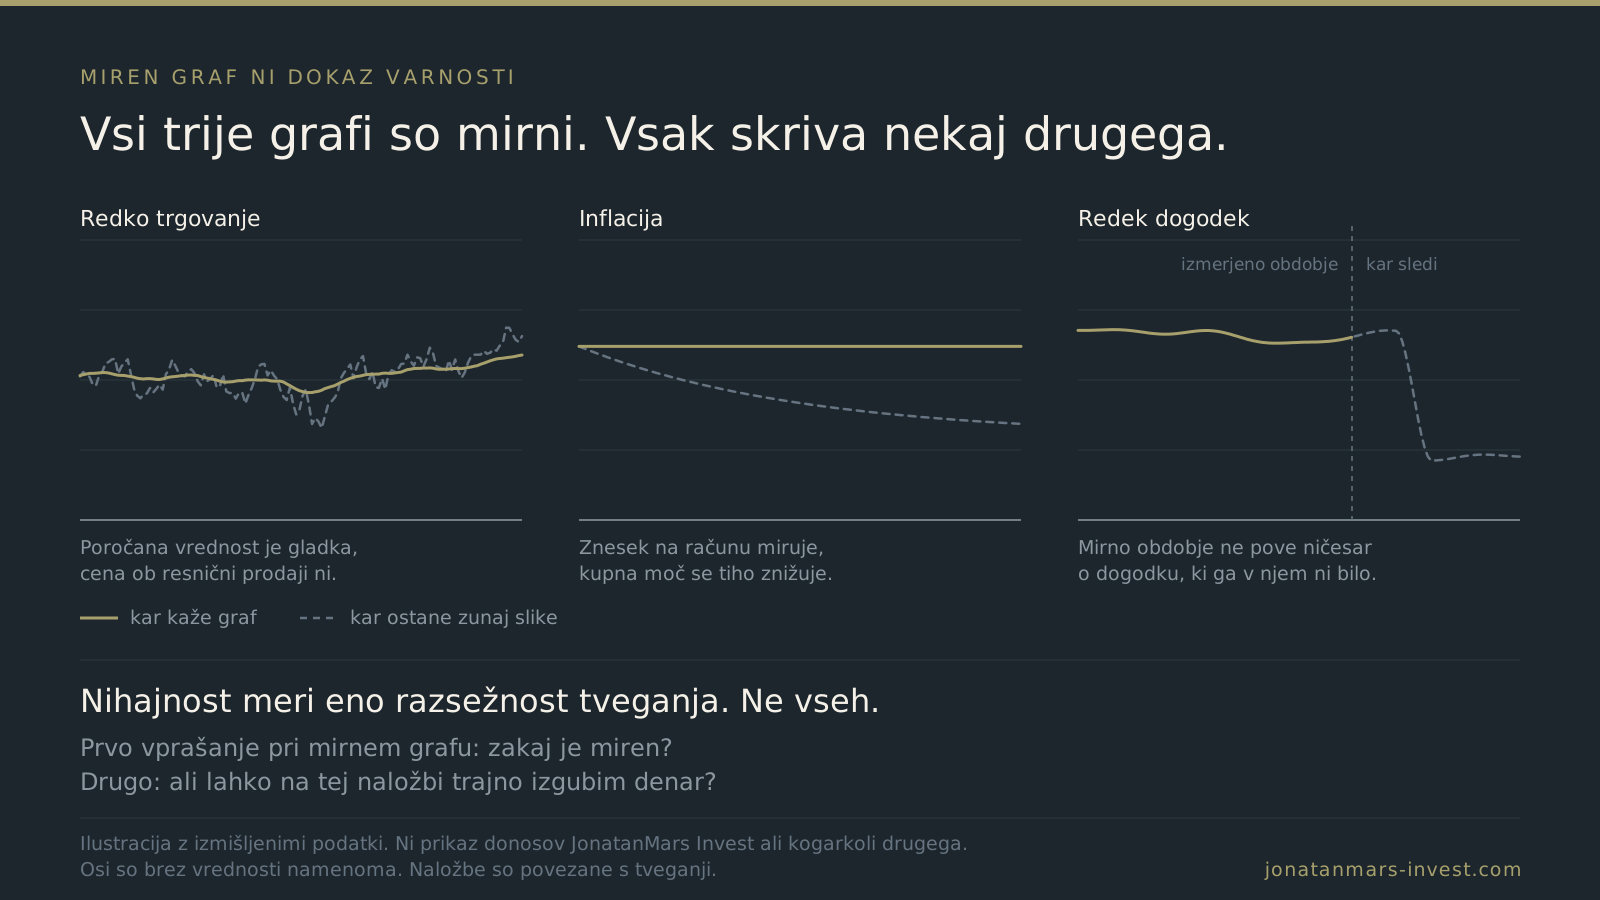
Some investments look calm because they trade infrequently or are valued using estimates rather than market prices. Research by Getmansky, Lo and Makarov showed that this kind of valuation can make measured volatility look lower than it really is. Risk measures then look better than the underlying investment deserves. The chart then mostly reflects the valuation method.
Liquidity is central here. The Bank for International Settlements describes a liquid market as one in which an asset can be sold quickly, at low cost and close to the current market price. It also warns that liquidity can deteriorate during stress. Private equity funds show a more everyday version of the same problem: capital calls continue while distributions slow, so an investor who needs cash may have to sell below the estimated value. A stable estimate tells you little about the price available in a real sale.
Cash in an account has the smoothest chart of all because its nominal amount does not move. Inflation still reduces what that money can buy. Even if inflation stays at the European Central Bank's 2% target, €10,000 in an account will buy in ten years about what €8,200 buys today. A cash reserve still makes sense for running costs and surprises. It does not protect you from inflation. "Nothing is happening" and "I am taking no risk" are two different statements.
Benoit Mandelbrot showed as early as 1963 that large market moves happen more often than a normal distribution predicts. A standard deviation calculated from a calm period tells us nothing about an event that did not occur during that period.
Nassim Taleb adds the question of decision-making. In his view, estimates are least reliable where extreme outcomes matter most, for example when leverage is involved. Alongside "what is the probability of loss?", it is sensible to ask "what happens to my portfolio if the risk model is wrong?"
Morgan Housel makes a similar point without statistics. Risk depends on the probability that an event affects us and on the possible range of consequences. A rare event with destructive consequences deserves more attention than a frequent but mild one.
For many people, the most important risk is the chance that their wealth will not do what they need it to do. Economist A. D. Roy described risk in 1952 as the probability that an outcome falls below a necessary minimum. Marks gives practical examples: a pension fund with payment obligations, or an investor who lives from their assets. Even a very smooth portfolio may be unsuitable if it cannot meet those obligations.
This logic works only with a realistic goal. If you expect a very conservative portfolio to produce returns historically associated with the riskiest investments, the problem lies in the expectation. An unrealistic wish does not make a conservative investment risky.
Elroy Dimson of London Business School captured risk in a line that Howard Marks often cites: "Risk means more things can happen than will happen." The future is not one path waiting to be guessed. Even carefully estimated probabilities can omit an outcome or assign it the wrong weight.
This leads to a simple principle of portfolio construction. A portfolio should survive a world in which the forecast is wrong.
So a smooth chart shows how measured prices moved, not whether an investment is safe. At JonatanMars Invest, we therefore do not assess risk through a single measure. We start with a suitability questionnaire that sets your risk profile from 1 to 7. The profile sets the range for shares and bonds, for example 50 to 60% shares and 35 to 45% bonds at profile 4. We rebalance Smart Beta portfolios, which are built from ETFs, once a quarter, or sooner if they drift materially from those ranges. We do not change your risk profile because markets fall. If the value of your portfolio falls by 10% or more since the last report, we notify you, as the law requires, and explain in writing what we did and what we did not do. Alpha also holds smaller companies, where liquidity is thinner and falls can be deeper, so we offer it only to investors with risk profiles 6 and 7.
If you would like to talk it through, book a free introductory consultation.
Is volatility a poor measure of risk?
No. Volatility is useful because it measures ordinary price movements consistently and helps with portfolio construction. It becomes misleading only when treated as a complete definition of risk. It measures observed price movement and misses permanent loss, liquidity, inflation and events absent from the historical data.
What is a permanent capital loss?
A loss from which the investment does not recover. It can arise when an investment fails for fundamental reasons or when an investor sells during a fall and locks in the loss. This is why the portfolio and time horizon should reduce the chance that you are forced to sell during a decline.
Does a fall in value mean I have lost money?
Not necessarily, but recovery is never guaranteed. Some declines prove temporary and others permanent, and it is often impossible to distinguish them while they are happening. "Can this investment recover, and why?" is more useful than "How much did it fall this week?"
Is an investment that barely moves safe?
Not necessarily. A smooth chart may also reflect infrequent trading or estimated valuations. Cash is perfectly smooth in nominal terms, but inflation reduces its purchasing power. Before investing, ask why the chart is smooth.
What is liquidity risk?
The risk that you cannot sell an investment quickly, cheaply and close to its recorded value when you need the money. It is often invisible in calm markets and can deteriorate precisely when you need liquidity most.
How much risk is suitable for me?
A general article cannot answer that. It depends on your goals, obligations, time horizon and ability to tolerate price swings.
This is a marketing communication and general educational material, not personal investment advice.
Investing involves risk. The value of investments may fall as well as rise, and you may receive less than you invested. Past and any simulated or tested returns are not a reliable indicator of future returns. Tax treatment depends on personal circumstances and applicable law, both of which may change.
Luka Gubo is director and lead investment manager at JonatanMars Invest. He has been trading and investing since 2006.
More insights

A stock count alone does not tell you how diversified a portfolio is. Weights, shared exposures and behaviour during bad periods matter too.

How to distinguish an attractive backtest from a result that is reproducible, robust and investable after costs.

What value, momentum and quality measure, why they may persist, and why each can disappoint for years.
Stay in touch